Laser Spectrum Analysis: Quantifying ASE, SMSR, and Spectral Purity
ENGPublished July 22, 2026 · 8 min read
Characterizing a laser diode's spectral output requires more than simply measuring peak wavelength and power. In real-world measurements, the recorded spectrum contains both the coherent laser emission and incoherent Amplified Spontaneous Emission (ASE) — a broadband background that degrades spectral purity and reduces the effective side-mode suppression ratio (SMSR).
Accurately separating these two components is essential for calculating true laser efficiency, assessing single-mode quality, and qualifying devices for dense wavelength division multiplexing (DWDM) applications.
What is ASE?
Amplified Spontaneous Emission arises from spontaneous photons that are amplified as they travel through the gain medium. Unlike stimulated emission (which produces coherent laser light), ASE is:
- Broadband: Spans tens of nanometers around the gain peak.
- Incoherent: No phase relationship between photons.
- Power-robbing: Extracts gain that would otherwise amplify the lasing mode.
In a measured spectrum, ASE appears as a broad "pedestal" or "shoulder" beneath the narrow laser peak. The ratio of peak laser power to maximum ASE level defines the Side Mode Suppression Ratio (SMSR):
For telecom-grade single-mode lasers, SMSR > 40 dB is typically required.
Method 1: Baseline (Shoulder Detection)
The simplest approach uses automatic shoulder detection to estimate the ASE baseline:
- Find the peak position and amplitude.
- Scan outward from the peak to locate the "shoulders" — local minima where the laser line transitions to the ASE pedestal.
- Interpolate a baseline between the left and right shoulder points (linear or polynomial).
- Separate components: Laser curve = signal − baseline; ASE curve = baseline.
This method works well for well-isolated laser peaks with clear shoulders.
Method 2: Log-Linear Fit (Advanced)
For asymmetric or distorted peaks, a more robust approach fits the peak region in log-space:
- Fit a Gaussian, Lorentzian, or Pseudo-Voigt profile to the peak region using Levenberg-Marquardt optimization.
- Compute the residual (data minus fitted profile) as the ASE estimate.
- Apply weighted fitting where peak points receive higher weight.
This method provides better accuracy when shoulders are not clearly defined.
Calculating Spectral Parameters
Once the laser and ASE components are separated:
- Laser Area: Trapezoidal integration of the laser curve.
- ASE Area: Trapezoidal integration of the ASE curve.
- Laser Fraction: [Laser Area / (Laser Area + ASE Area)] · 100%
- FWHM: Full Width at Half Maximum of the laser component only.
- SMSR: Peak power divided by maximum ASE level (in dB).
Laser Pulse Characterization
Beyond spectral analysis, temporal pulse characterization is equally important for pulsed laser systems. Key parameters include:
- Rise Time (t₁₀ ➔ t₉₀): Time for the pulse to rise from 10% to 90% of peak amplitude.
- Fall Time (t₉₀ ➔ t₁₀): Time for the pulse to decay from 90% to 10%.
- Pulse Width (t₅₀): Full width at half maximum (FWHM) of the temporal pulse.
- Duty Cycle: Ratio of pulse width to period [t_pulse / T · 100%].
- Repetition Rate: f_rep = 1 / T.
These parameters are critical for applications like optical communications (where rise time limits bandwidth), LIDAR (where pulse width determines range resolution), and laser machining (where duty cycle affects thermal accumulation).
The AltaiPlot Advantage: Integrated Laser Analysis
Manually implementing shoulder detection algorithms, fitting routines, and SMSR calculations in Python scripts is error-prone and time-consuming. Each spectrum requires custom code for peak finding, baseline interpolation, and integration. AltaiPlot provides a dedicated Laser/ASE Analysis Tool that automates this entire workflow:
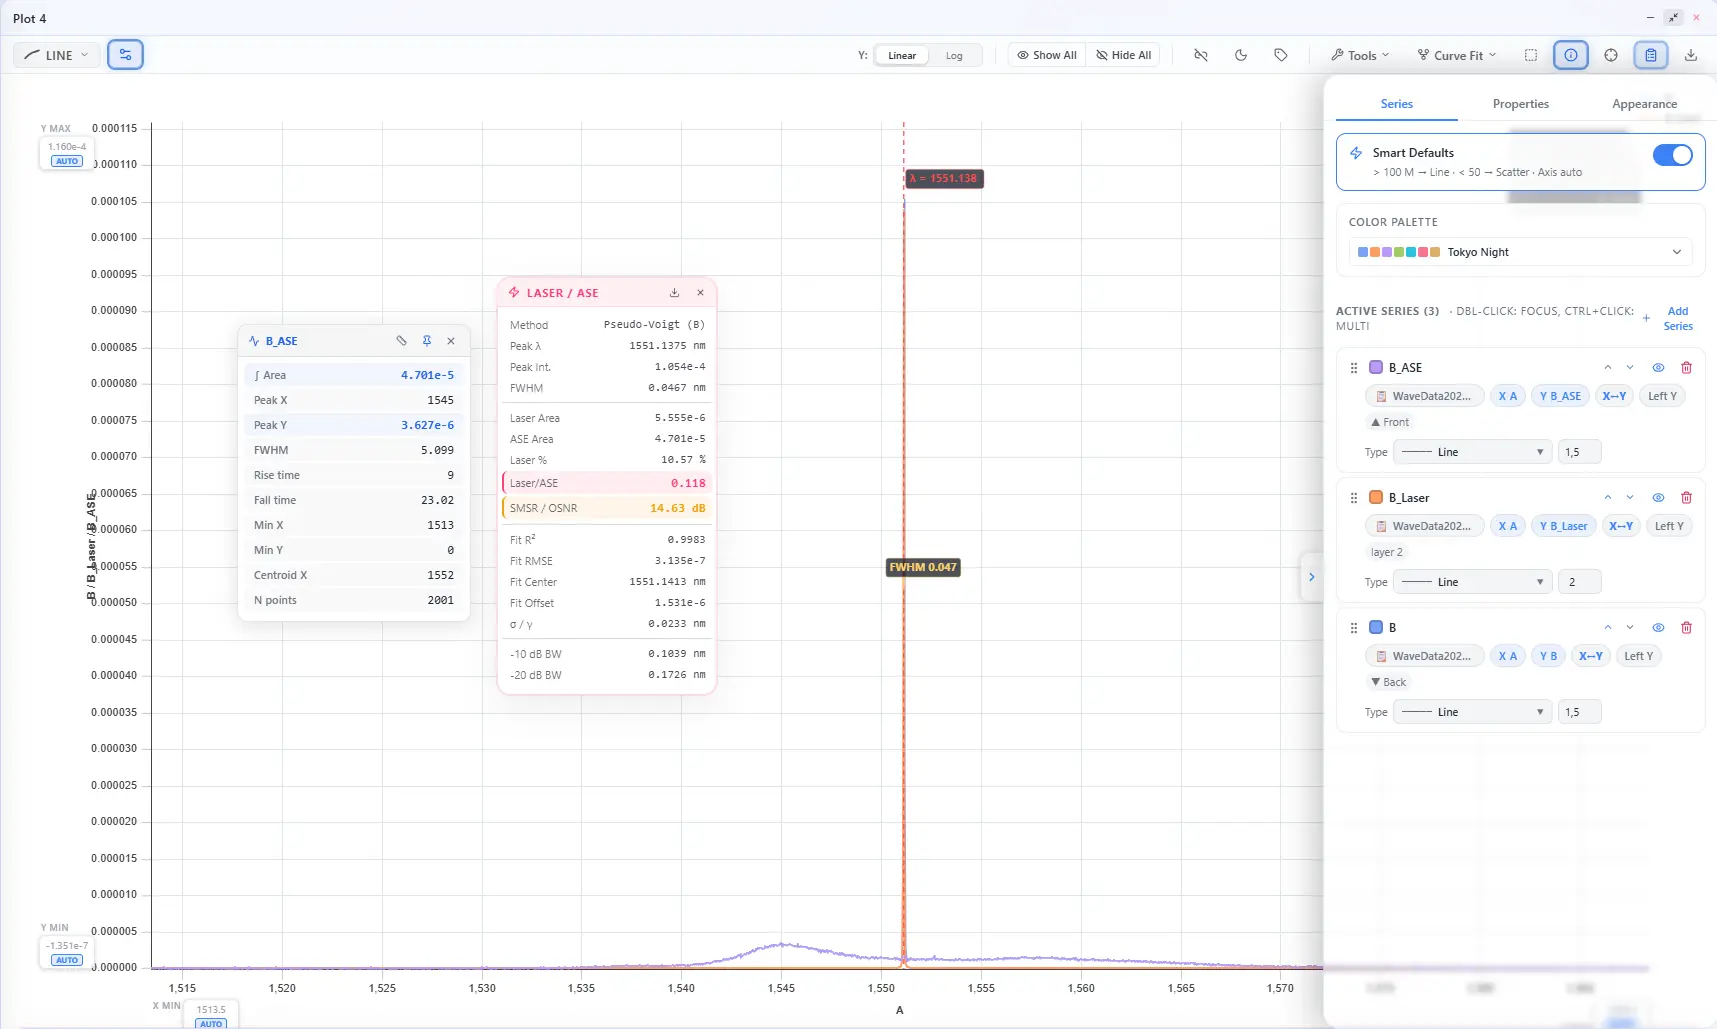
- Two Analysis Methods: Choose between automatic shoulder detection (Method A) for clean spectra, or log-linear fitting (Method B) for asymmetric or complex peaks. Both methods run in under 2ms on typical spectra.
- Real-time Component Separation: The tool instantly decomposes your spectrum into laser and ASE curves, displayed as overlapping traces with distinct colors. Adjust the fit window fraction interactively to optimize shoulder detection.
- Automatic SMSR Calculation: SMSR is computed directly from the separated components, eliminating manual peak-search and baseline-estimation steps.
- Spectral and Pulse Analysis: Switch between laser spectrum mode and pulse characterization mode to measure rise time, fall time, pulse width, duty cycle, and repetition rate — all from the same analysis toolbar.
- Preset Profiles: Pre-configured settings for common laser types (telecom DFB, broad-area, femtosecond pulsed) accelerate routine measurements.
- Export Results: All parameters (peak wavelength, FWHM, laser fraction, SMSR, rise/fall times) are written to a dedicated results sheet for further analysis or reporting.