XRD Peak Fitting: Profile Models, Bragg's Law, and Crystallite Size
ENGPublished July 22, 2026 · 8 min read
X-Ray Diffraction (XRD) is the gold standard for analyzing crystalline structures. However, extracting physical parameters like phase purity, lattice strain, and crystallite size from a diffractogram requires fitting individual diffraction peaks.
Bragg's Law and Diffraction Peaks
Every diffraction peak corresponds to a specific lattice plane spacing (d) satisfying Bragg's Law:
Where λ is the X-ray wavelength and θ is the diffraction angle. Fitting the peak position allows high-precision calculations of lattice constants and micro-strain properties.
Estimating Crystallite Size (The Scherrer Equation)
The width of a diffraction peak is inversely proportional to the crystallite size. Finite crystallite domain size limits coherent X-ray scattering, causing diffraction peak broadening. We calculate crystallite size (τ) using the Scherrer Equation:
Where:
- K is the dimensionless shape factor (typically 0.9).
- λ is the X-ray wavelength (e.g., 0.15406 nm for Cu K-alpha).
- β is the line broadening at half the maximum intensity (FWHM) in radians, after subtracting instrumental line broadening.
- θ is the Bragg angle.
Profile Shapes: Gaussian, Lorentzian, and Pseudo-Voigt
Choosing the right mathematical model for peak shape is vital:
- Gaussian Profile: Represents instrumental broadening (slits, optics) and microstrain (lattice strain) broadening.
- Lorentzian Profile: Represents finite crystallite domain size broadening.
- Pseudo-Voigt Profile: A linear combination of both. It is the most realistic model for actual XRD peaks:
Where η (between 0 and 1) is the Lorentzian fraction. If η = 1, the peak is pure Lorentzian; if η = 0, it is pure Gaussian.
The AltaiPlot Advantage: Instant Crystallite Size
Calculating crystallite size traditionally involves exporting peak parameters to spreadsheets and manually typing the Scherrer formula. AltaiPlot streamlines XRD analysis with workflow guidance:
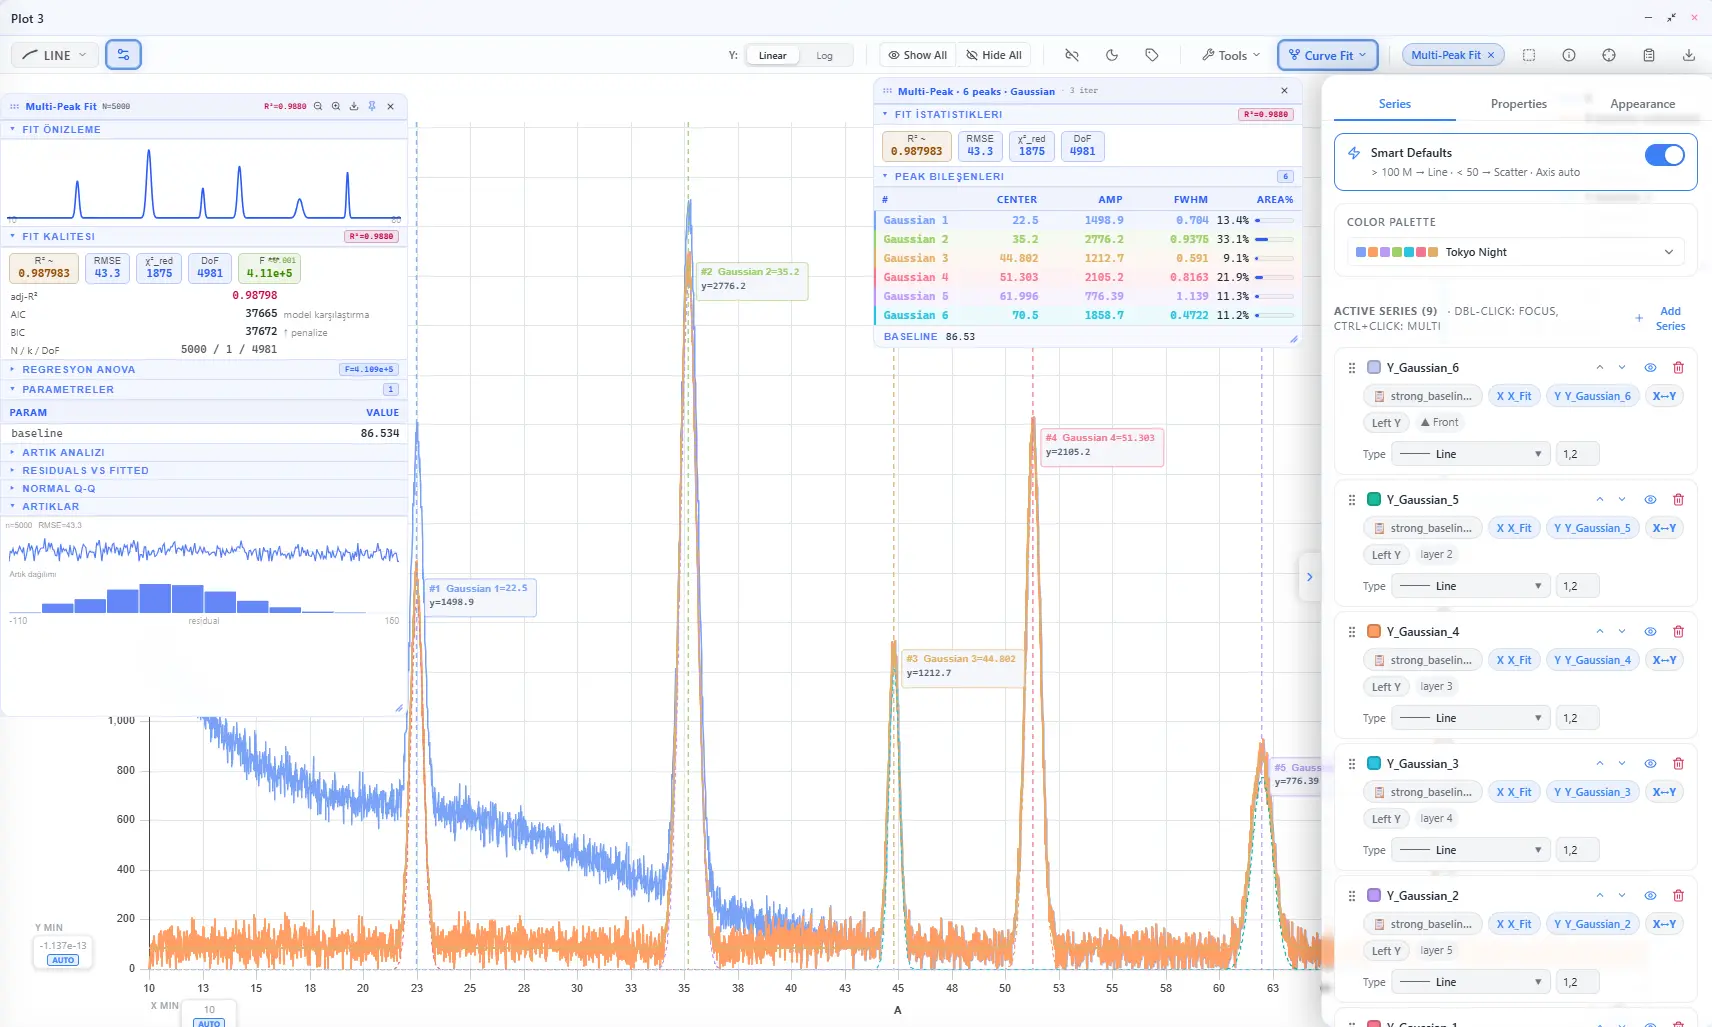
- XRD Data Type Detection: AltaiPlot recognizes XRD datasets and suggests appropriate processing chains — baseline correction, smoothing, then peak detection.
- Multi-Peak Fitting with Profile Selection: Fit overlapping peaks using Gaussian, Lorentzian, or Pseudo-Voigt profiles. The solver optimizes center, FWHM (β), and shape factor (η) simultaneously.
- Scherrer Analysis via Script Console: After fitting, use the built-in Scherrer formula in the Python console to calculate crystallite size from your fitted FWHM values — the console includes pre-built snippets for common crystallography calculations.